

ChartNet: The Million-Scale Dataset Teaching AI to Actually Read Charts
Have you ever shown a chart to ChatGPT and received an answer that sounded convincing, but was wrong? It might capture the overall trend while misreading bar height, confusing two series, or reporting a value that does not appear in the chart at all.
The problem goes beyond recognizing what a chart looks like. Charts connect visual geometry, numerical data, and language. Extracting a table, reconstructing a plot, or answering a multi-step question requires a model to move reliably among all three.
ChartNet’s results suggest that, for chart understanding, scaling model size is far less effective than providing high-quality, code-aligned multimodal supervision. ChartNet addresses this data bottleneck with million-scale, aligned supervision for chart reconstruction, data extraction, summarization, and reasoning.
1. Why Chart Understanding Needs Aligned Supervision
The challenge begins with what a chart contains and how little of that structure may be visible in any single training target.
1.1 A Chart Connects Several Representations
Position, length, color, and grouping form a chart’s visual geometry. Behind them are categories, values, series, and units. Titles, labels, legends, and annotations explain what those structures mean.
Different tasks require different transformations among these representations. Data extraction turns geometry into a table. Reconstruction maps an image to plotting code. Summarization expresses quantitative evidence in language. Reasoning connects several observations before arriving at an answer.
1.2 Existing Datasets Capture Only Parts of That Relationship
Existing chart datasets often cover only part of this loop. Some focus on a single task; others omit code, tabular data, grounding, or reasoning traces. ChartQA, for example, is biased towards questions requiring basic data extraction, resulting in performance saturation for modern vision-language models.
The result is fragmented supervision: models may see an image and a question without the data that produced the image, or code without the language and reasoning needed to interpret it.
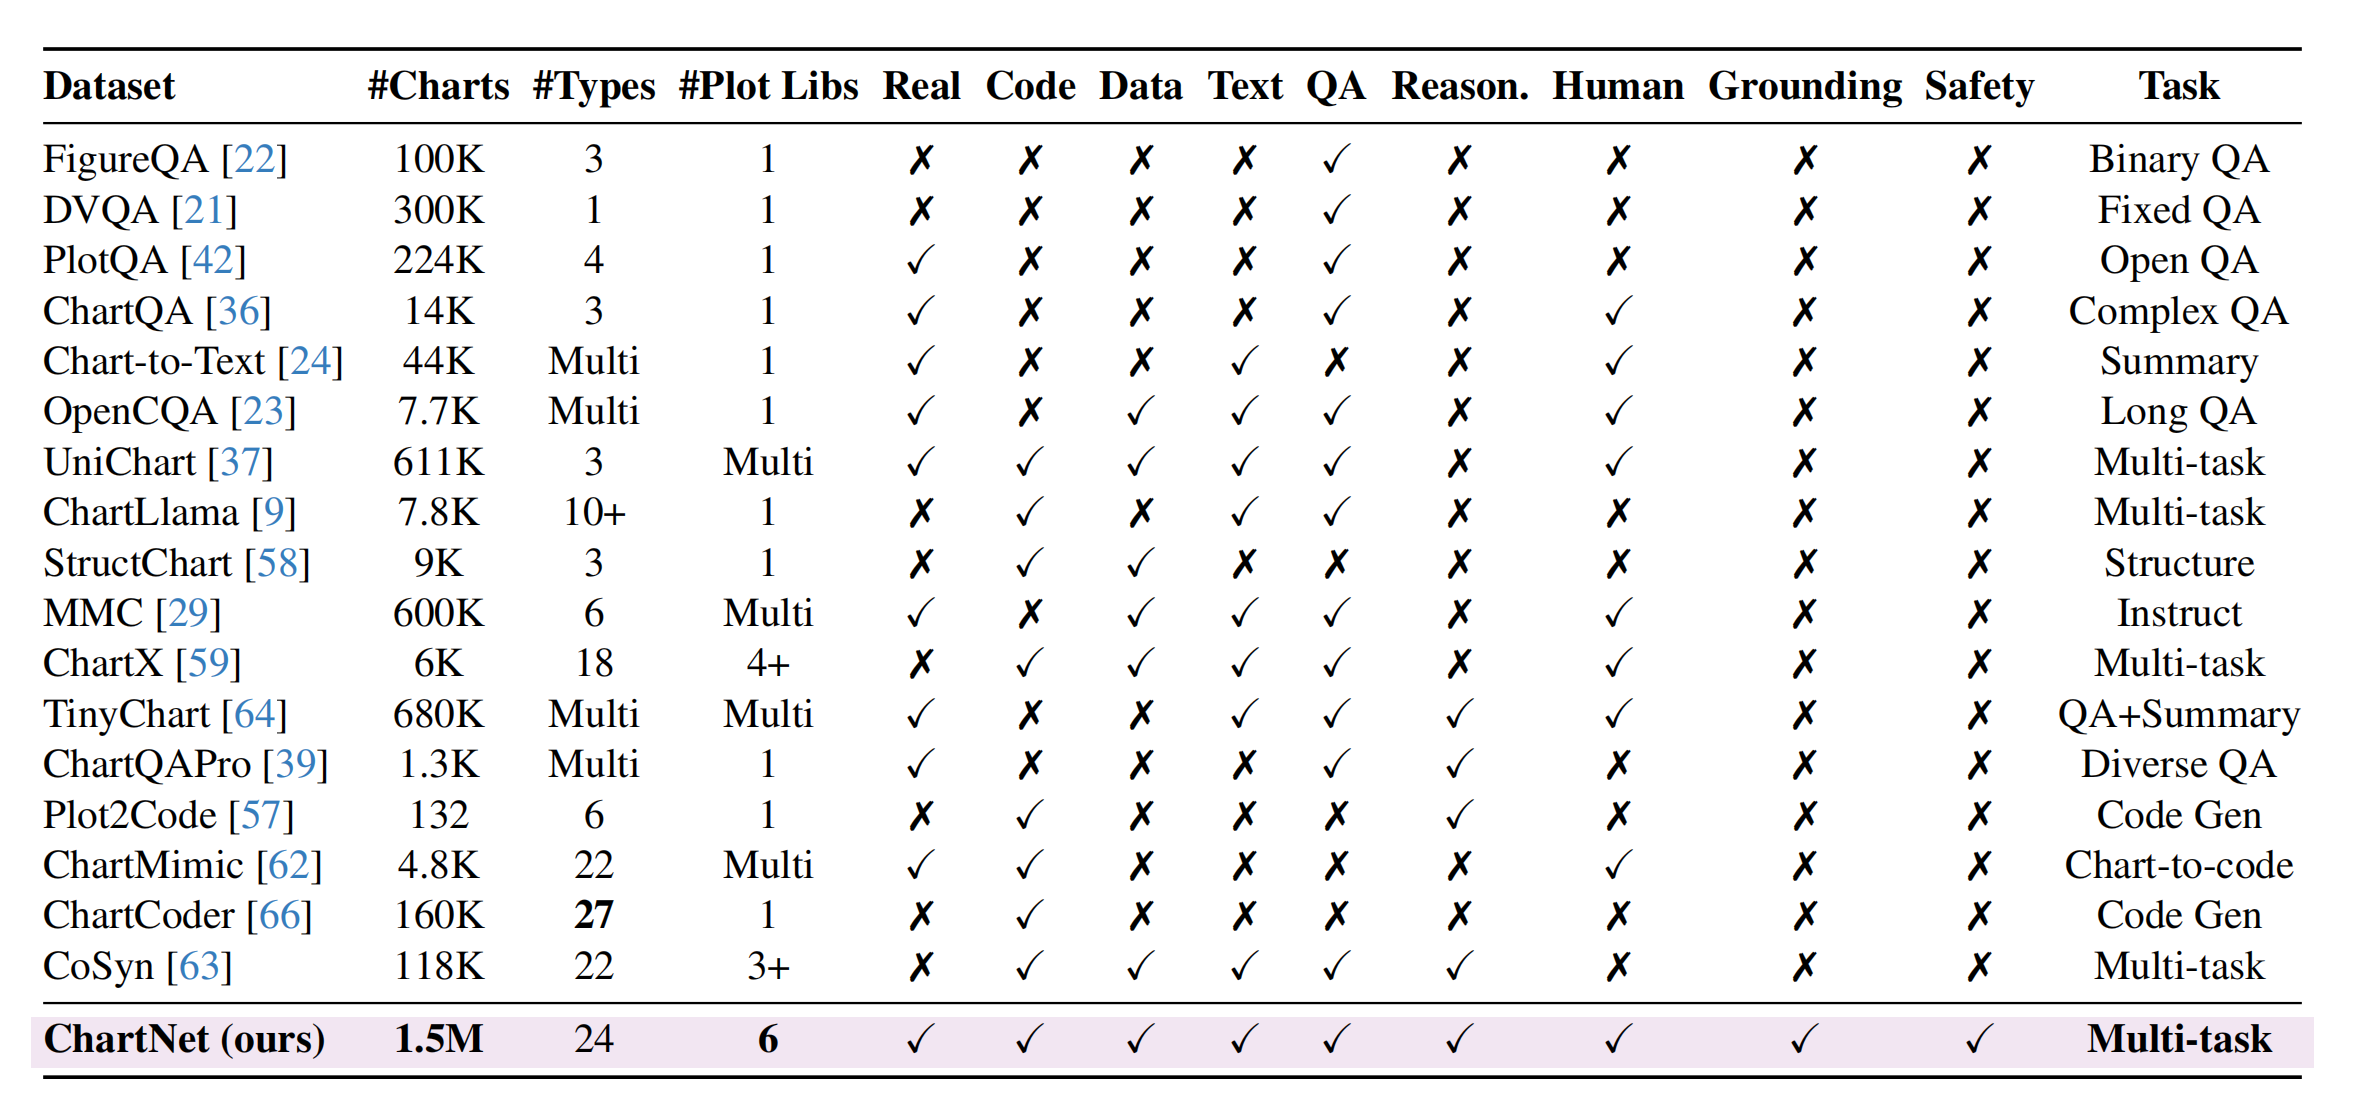
A more complete training signal needs scale and chart diversity, but it also needs aligned image, code, data, text, and reasoning. That is the structure ChartNet was built to provide.
2. What ChartNet Contains
If incomplete relationships are the problem, the dataset must connect them within the same examples.
2.1 One Chart, Five Aligned Representations
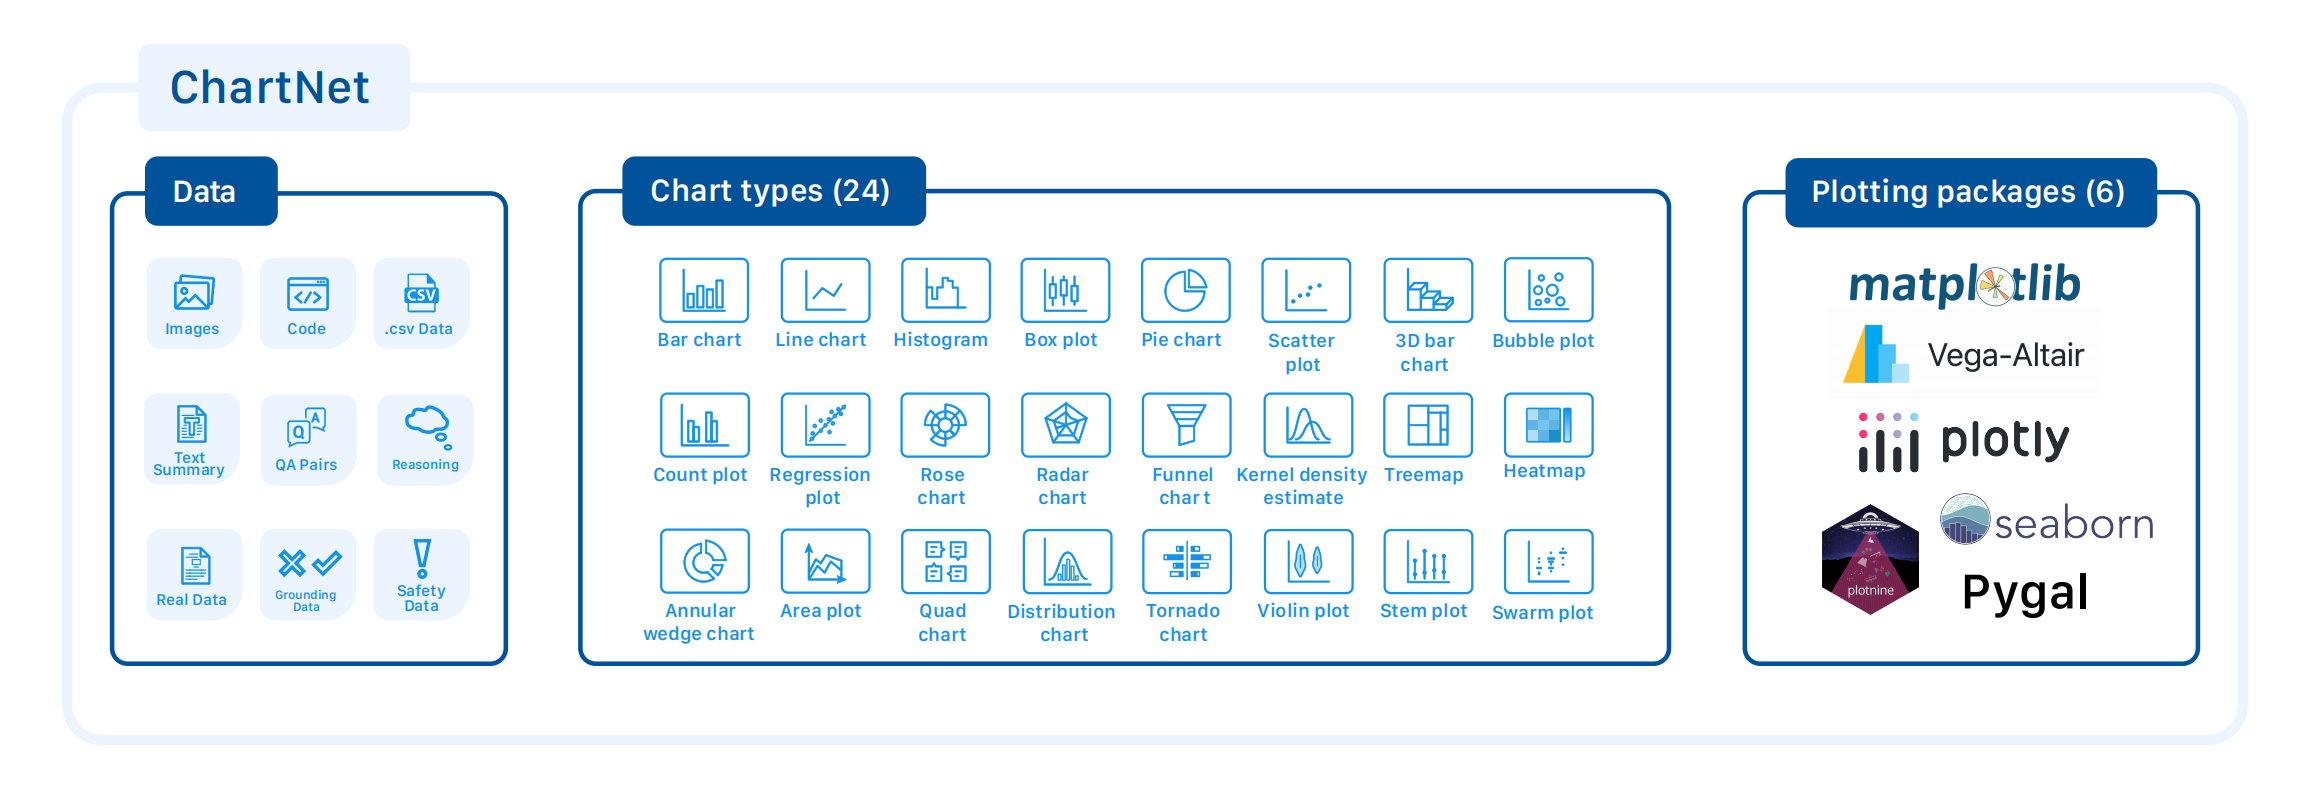
The ChartNet core contains 1.5 million aligned synthetic tuples. Each brings together:
a rendered chart image;
executable Python plotting code;
an underlying CSV table;
a natural-language description;
and QA pairs with chain-of-thought reasoning.
Alignment matters because these are not five unrelated collections. They are five views of the same chart. A model can learn to move from image to table, image to code, image to description, or chart evidence to a reasoned answer while the underlying content remains connected.
2.2 Scale and Diversity
The core dataset spans 24 chart types and six plotting libraries. The 1.5 million tuples provide training scale; the range of chart types broadens visual structure; and the different libraries introduce variation in code, styling, layout, and rendering conventions. That scale is reached after execution checks and visual filtering: on average, 77% of generated code snippets execute successfully, and 36.5% of rendered images are flagged by a vision-language model for visual errors and removed.
The distribution is not uniform: some chart types are more prone to execution or rendering errors, while some plotting libraries execute less reliably or are selected less often. Even low-frequency categories, however, account for thousands of charts.
2.3 Beyond the Synthetic Core
ChartNet adds four specialized resources to the core dataset:
Human-annotated data: 96,643 synthetic chart-image, description, and table examples that underwent human verification and annotation.
Real-world charts: 30,000 charts from sources including the World Bank, Bain Insights, Pew Research Center, and Our World in Data, paired with descriptive metadata.
Grounding data: Geometry-aware annotations and QA pairs that connect questions and answers to specific chart elements and regions.
Safety data: 7,000 training samples and 600 test samples with adversarial questions and paired safe and unsafe responses.
These subsets provide starting points for studying annotation quality, real-world chart distributions, visual grounding, and safety alignment. Their inclusion supports those research directions; it does not by itself establish that a trained model has mastered them.
ChartNet therefore addresses the original data gap at three levels: scale, alignment, and broader research coverage. The next question is how to build those connected representations at million-scale without losing visual quality.
3. Scaling Aligned Chart Data Through Code
3.1 Why Code Is Intermediate Representation
Charts are commonly generated by programs. Plotting code explicitly contains data values, labels, chart structure, and rendering logic. Because it is both structured and executable, it can be edited to create variations, rendered into an image, and used as context when deriving tables and descriptions.
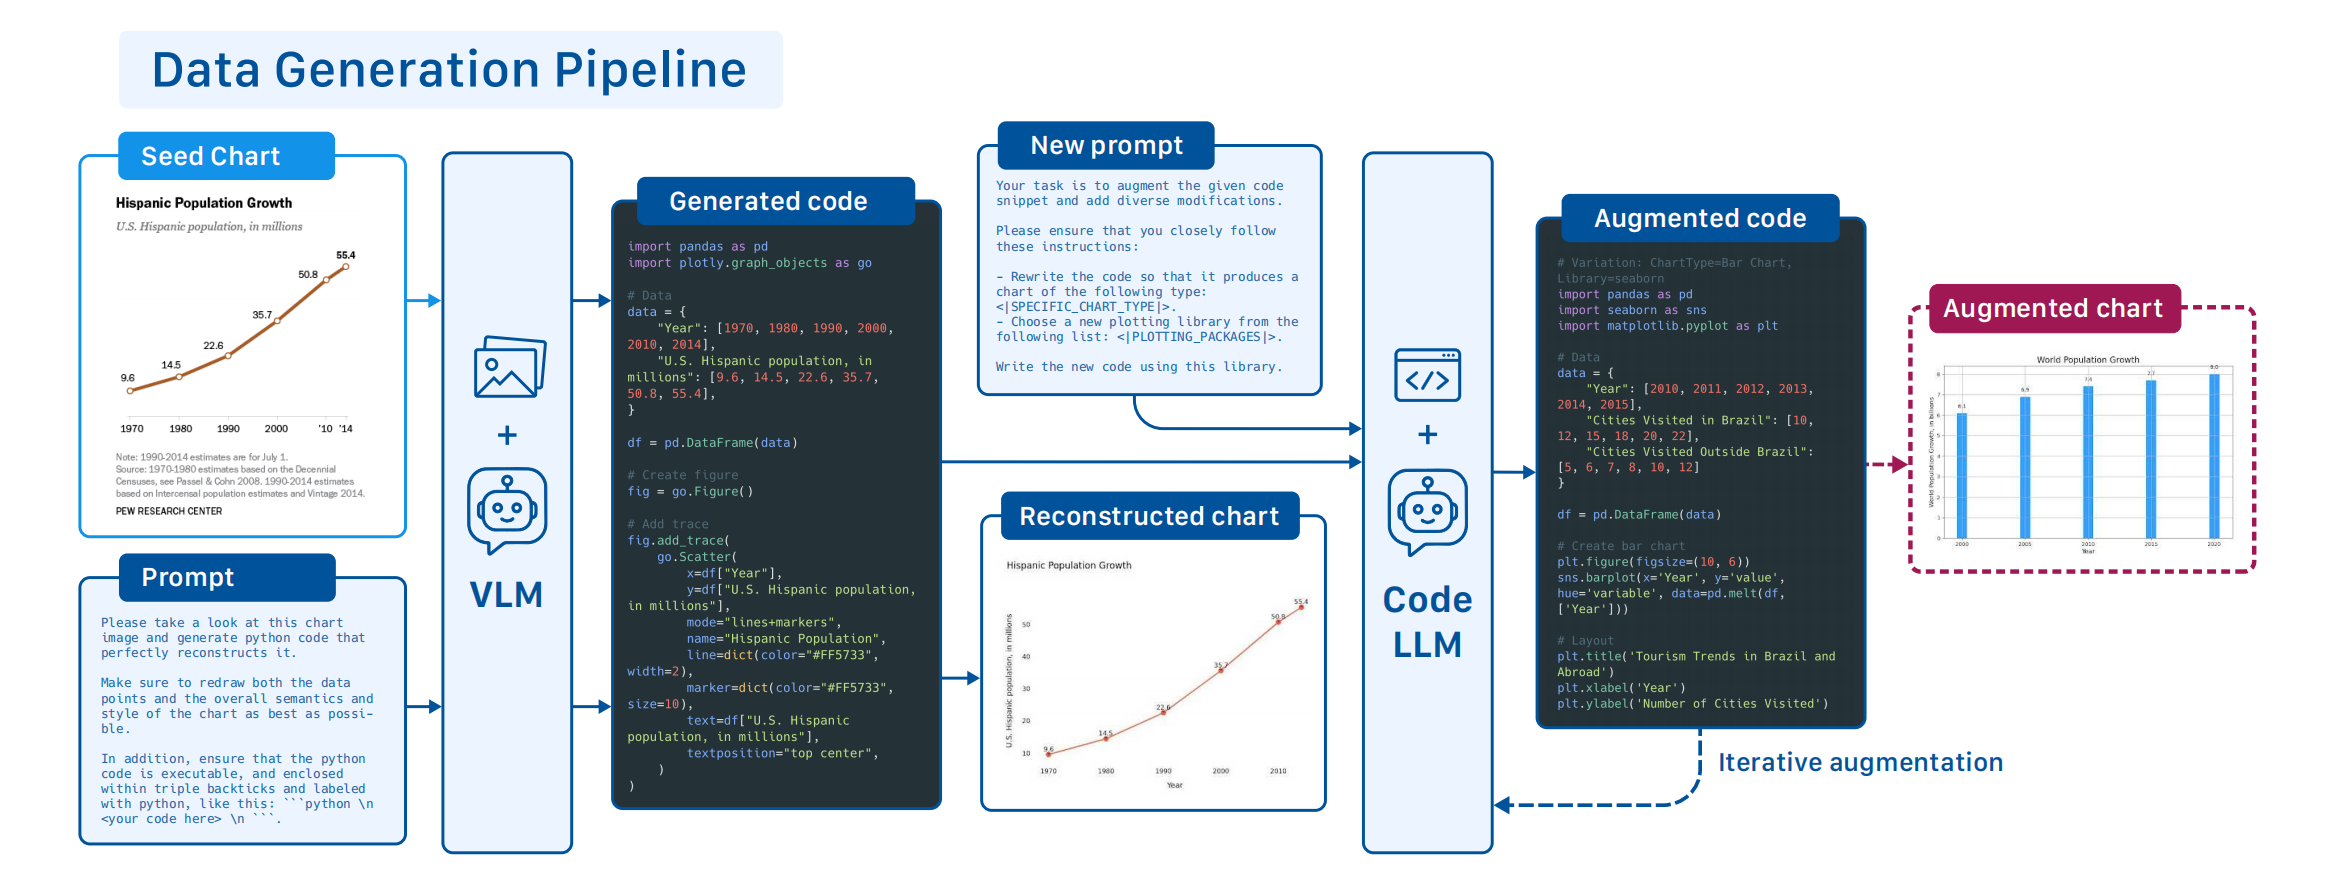
The seed image is not assumed to be recovered exactly. ChartNet first translates it into code that approximately reconstructs the chart, then uses that code as the starting point for generation.
3.2 Scale: Reconstruct, Augment, Render
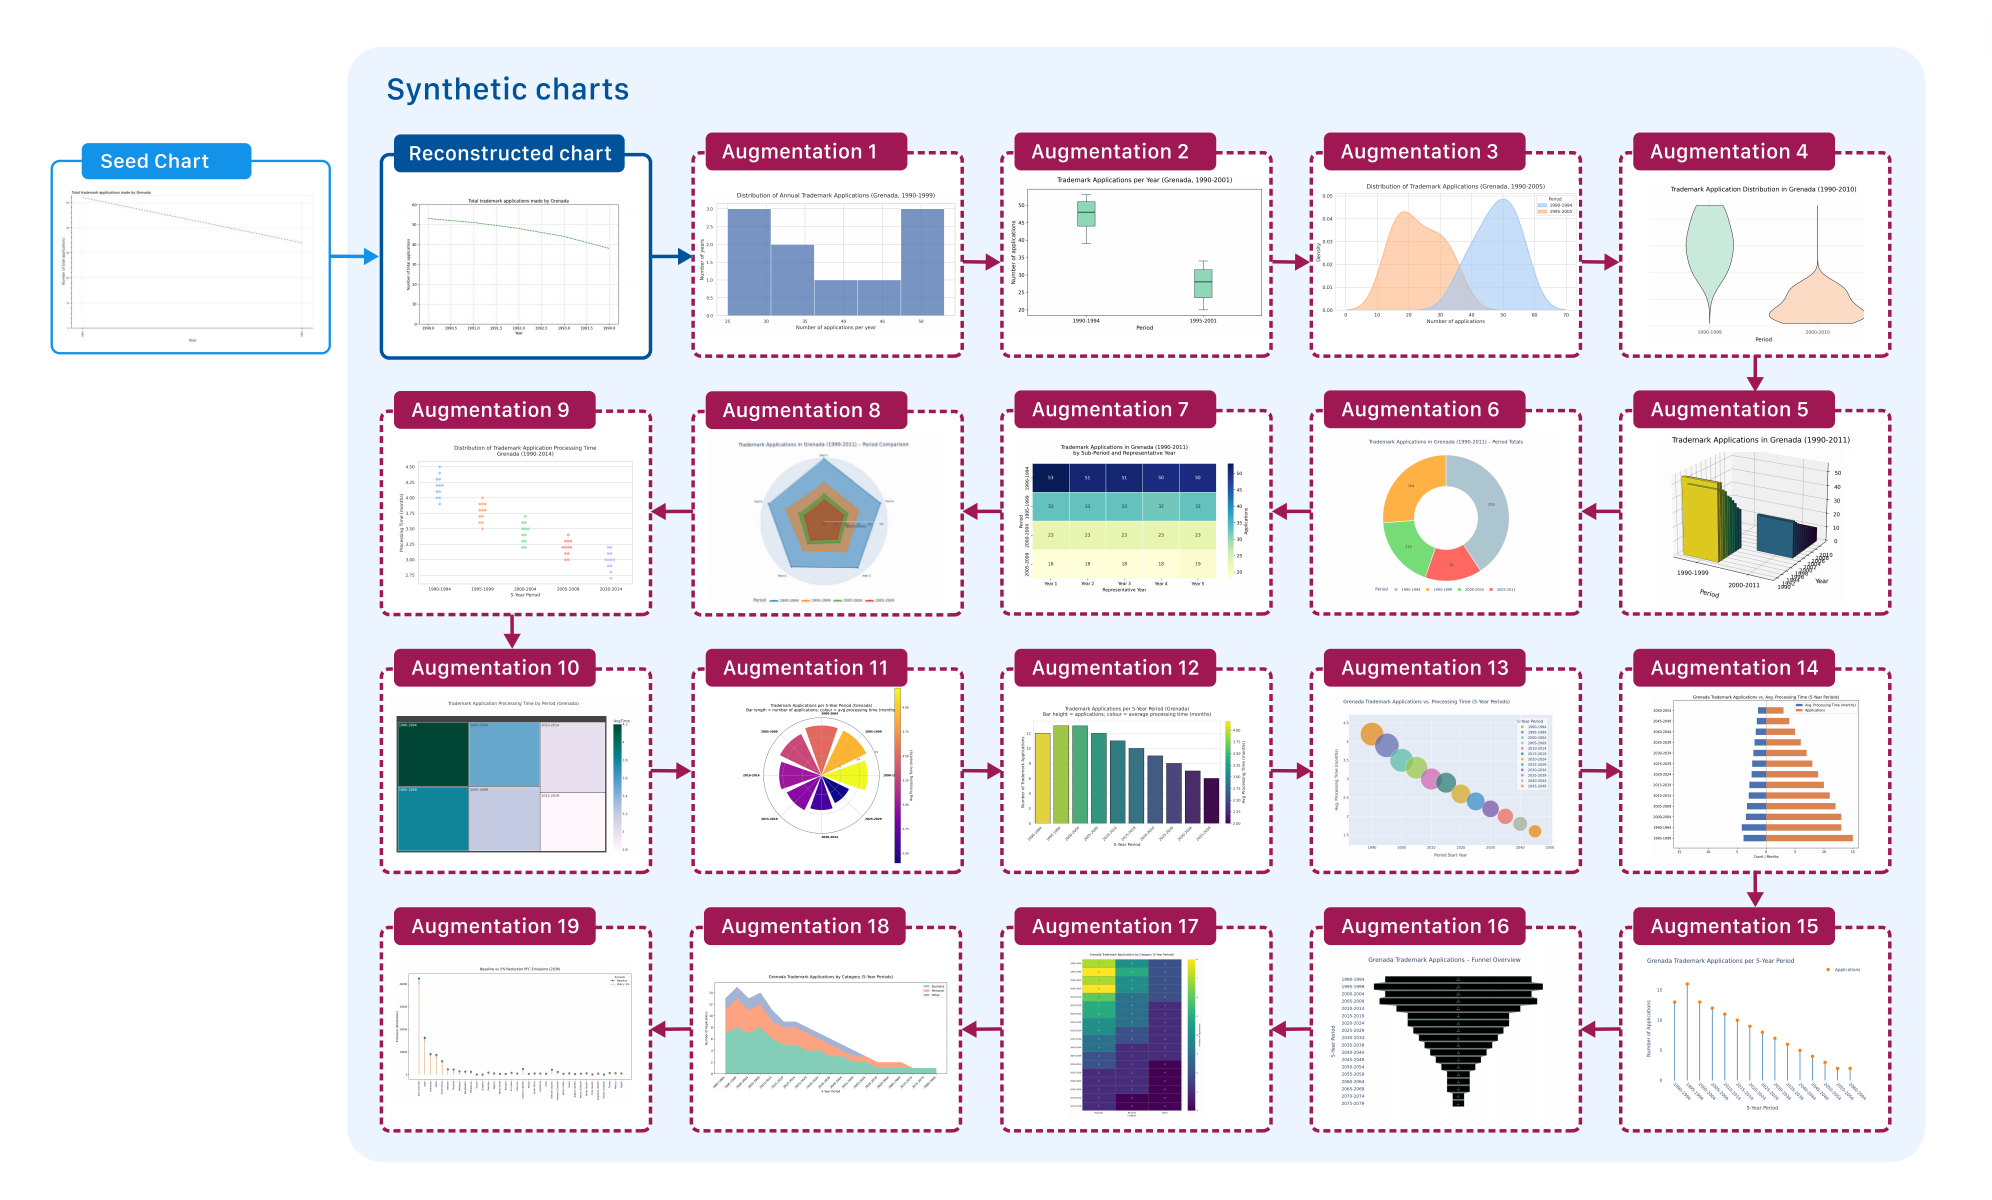
The pipeline begins with 150,000 unique TinyChart seed images. A vision-language model produces approximate plotting code, and a language model iteratively rewrites it by varying the data, chart type, and plotting library. Programs that execute successfully are paired with their rendered images.
A single seed can consequently produce charts with different structures, data arrangements, styles, and implementations.
3.3 Quality and Alignment: Filter, Then Derive Supervision
Generated charts are screened by a vision-language model for eight categories of visual problems, including overlapping labels, cropped content, obscured data, and semantic inconsistencies. Using a human-reviewed sample of 3,157 charts as the reference, 14.9% of generated charts had readability issues before filtering, compared with 5.9% of charts that passed filtering.
For the retained chart-code pairs, the pipeline derives CSV tables and natural-language descriptions using the code and image as connected context. QA generation builds on the Vision-R1 framework. A teacher VLM writes a multi-step question, then assembles a four-part pseudo-CoT following LLaVA-CoT: Summary, Caption, Reasoning, and Conclusion. A modality-bridging step translates the relevant visual evidence into text, allowing gpt-oss-120b to generate a long-form reasoning trace and final answer without direct access to the image. Filtering addresses visual usability; attribute generation turns each accepted pair into aligned multimodal supervision.
4. What Changes After Training on ChartNet
The dataset’s structure is useful only if models learn from it. The experiments test that question at three levels: paired improvements, comparison with larger baselines, and transfer to public benchmarks.
4.1 Evaluation at a Glance
Five models from four model families, ranging from 256 million to 7 billion parameters, were fine-tuned and evaluated on reconstruction, data extraction, summarization, and reasoning QA.
Evaluation scope
Internal test set: 2,000 synthetic ChartNet tuples held out from training
Training: Each task uses its corresponding ChartNet subset
Automatic metrics: GPT-4o served as judge except for reasoning QA
External tests: ChartCap and ChartMimic-v2 evaluated public-benchmark transfer
The internal and external evaluations answer different questions. The first measures gains across all four ChartNet tasks; the second tests whether selected gains extend beyond ChartNet’s synthetic held-out distribution.
4.2 Consistent Gains Across Models and Tasks
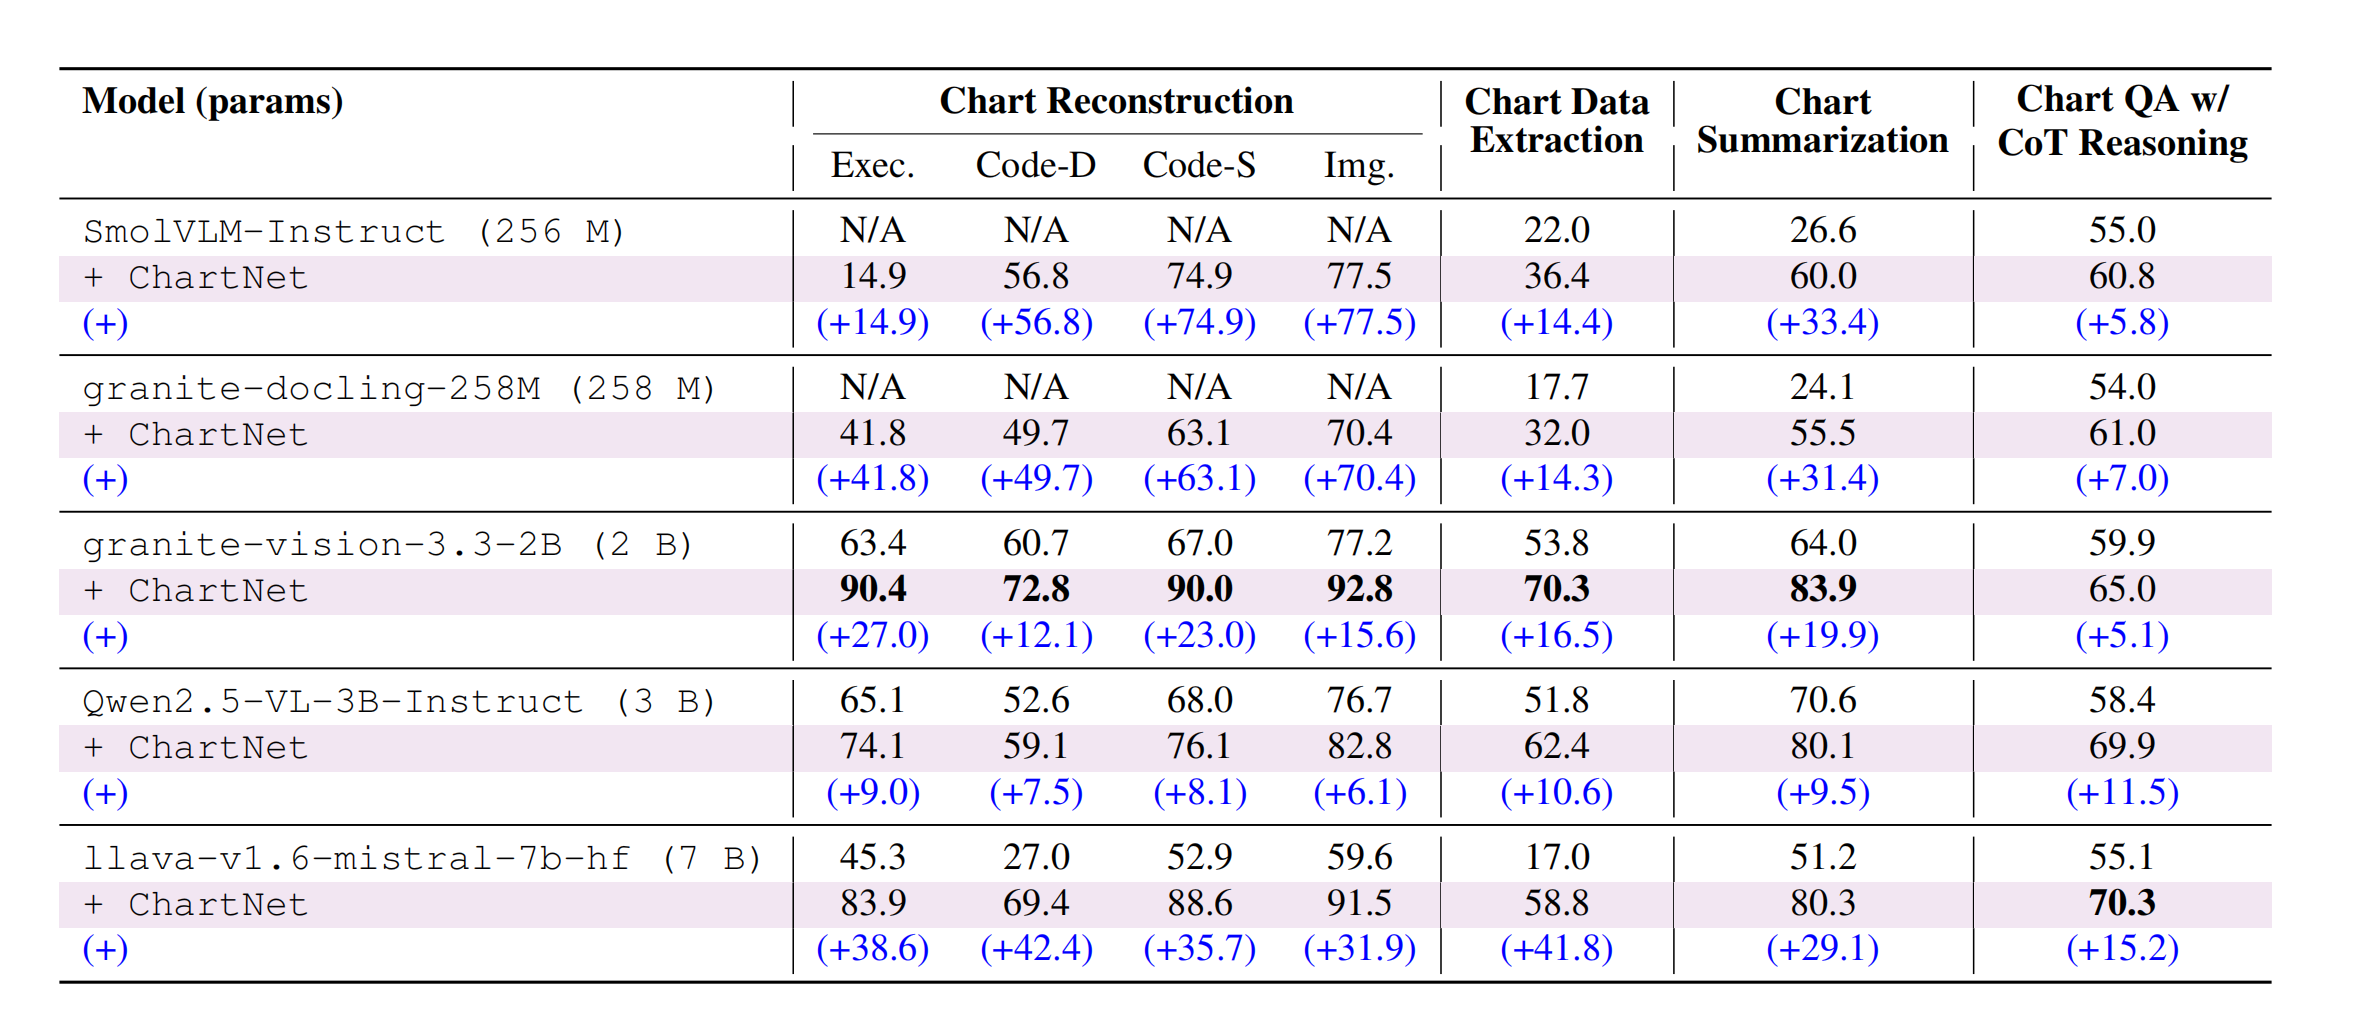
Every evaluated model family improved after task-specific ChartNet fine-tuning. The two ultra-compact models, SmolVLM-256M and Granite-Docling-258M, also gained measurable chart-reconstruction capability where their base versions were reported as N/A.
Models with existing chart capabilities improved as well. Granite-Vision-2B, for example, raised reconstruction execution from 63.4 to 90.4 while also improving its data, code, and image-similarity scores.
4.3 How the Tuned Models Compare with Larger Baselines
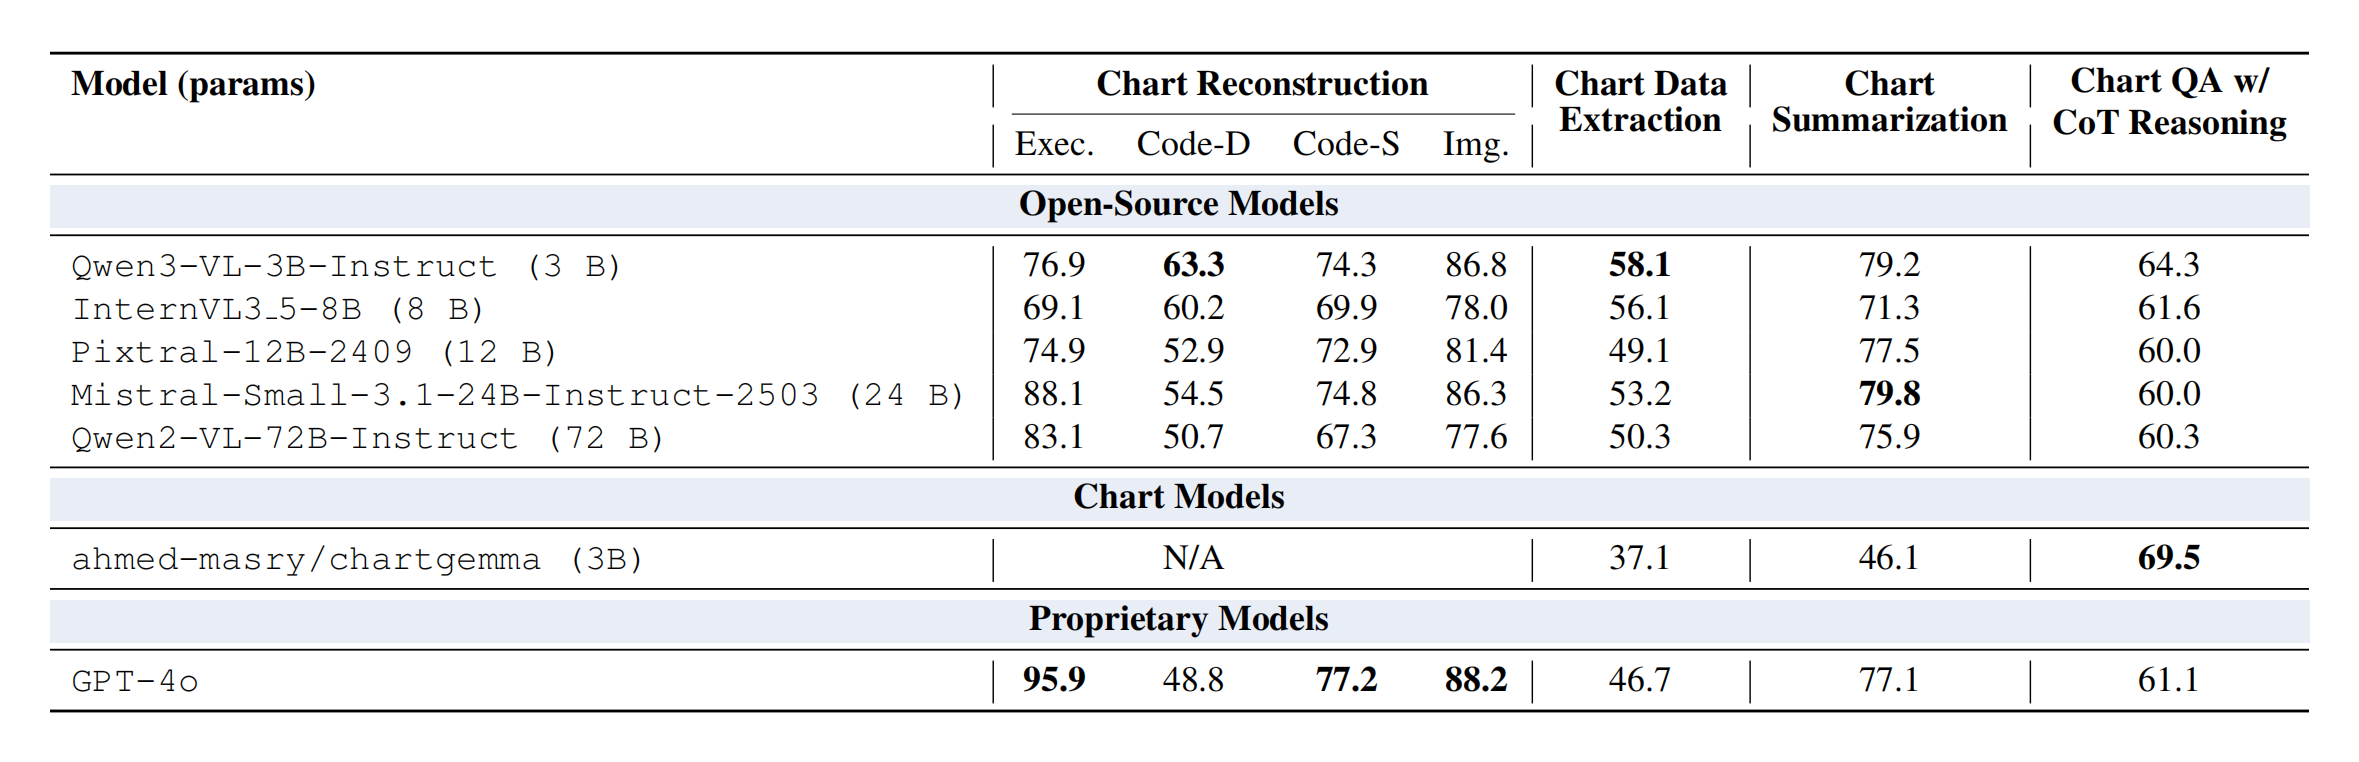
Granite-Vision-2B reaches 70.3 on chart data extraction and 83.9 on summarization. Both results exceed the off-the-shelf open-source baselines reported in Table 3, including models with up to 72 billion parameters, as well as GPT-4o’s scores on those two tasks.
LLaVA-7B improves by 41.8 points on data extraction, from 17.0 to 58.8. On reasoning QA, it reaches 70.3, compared with 69.5 for ChartGemma and 61.1 for GPT-4o.
These are task- and metric-specific comparisons. They do not mean that every tuned model performs best on every task; GPT-4o, for example, retains the highest reconstruction execution rate.
4.4 Transfer to Public Benchmarks
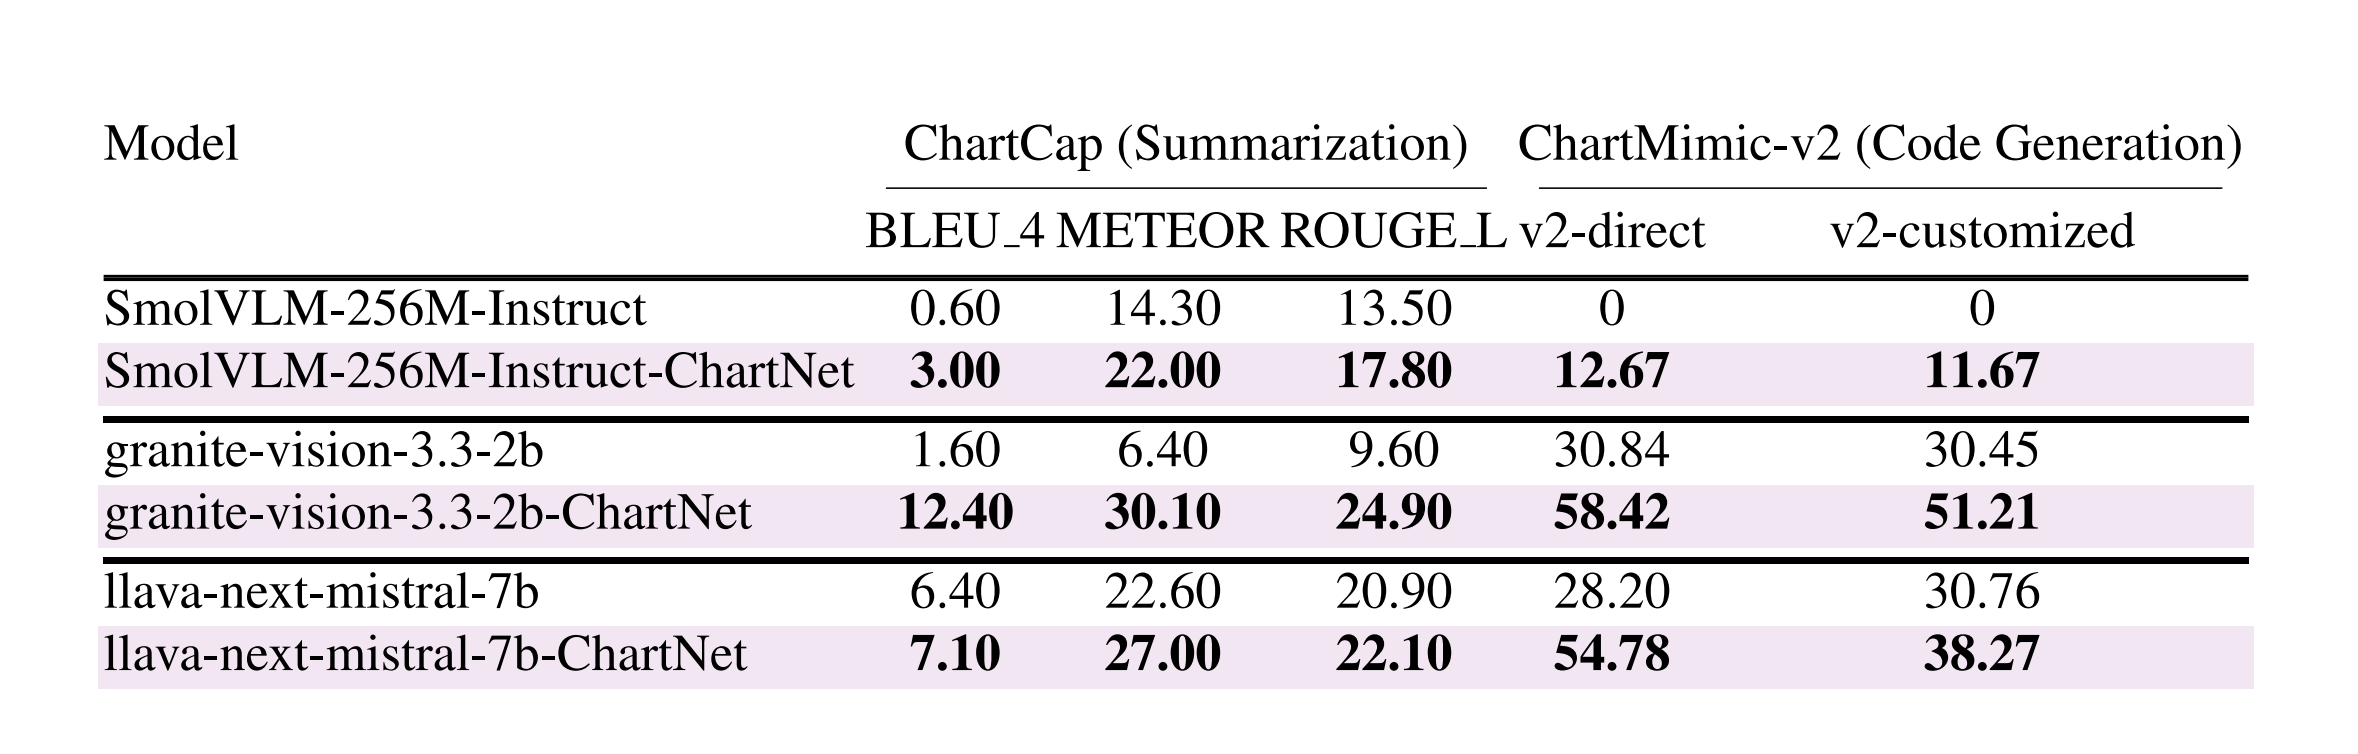
On ChartCap, Granite-Vision-2B improves from 1.6 to 12.4 BLEU after ChartNet fine-tuning. On ChartMimic-v2, its v2-direct score rises from 30.84 to 58.42.
These two benchmarks test summarization and chart-to-code generation outside ChartNet’s own synthetic held-out set. They do not cover every ChartNet task, but they show that part of the improvement transfers to external evaluation data.
5. An Open Foundation for Chart Research
The experiments show what ChartNet can change during fine-tuning. Its public release makes the underlying data and methodology available for researchers to reuse and extend.
5.1 What Is Now Reusable
ChartNet is publicly available on Hugging Face. The paper documents the generation pipeline, model roles, prompts, filtering criteria, training setup, and evaluation methodology.
The release provides a reproducible entry point for chart-understanding research without implying that every implementation component or fine-tuned checkpoint has been made public.
5.2 What Researchers Can Explore Next
The aligned core supports training and evaluation across reconstruction, extraction, summarization, and reasoning. The specialized data provides additional entry points for grounding, safety alignment, human-verified supervision, and real-world chart distributions.
The paper also notes that the reconstruction pipeline is not tied to the TinyChart seed choice. Researchers can investigate additional chart sources and forms of annotation while retaining code as the executable intermediate representation.
6. The Dataset Is Live
ChartNet is publicly available right now on HuggingFace:
👉 huggingface.co/datasets/ibm-granite/ChartNet
Use ChartNet to fine-tune models, benchmark new architectures, extend code-guided generation, or explore grounding, safety, and real-world chart understanding.
The goal is simple: make the connections between a chart’s visuals, data, and language more reliable.